
UI graphics ENGINEERINg
hvac application SYSTEM / energy DASHBOARDs / Control points
Applied engineering submittals to develop and implement design systems for clients across O’Hare Airport, healthcare facilities, military bases, educational institutions, and manufacturing plants. Led the design of visually engaging interface graphics for engineered automation tools, ensuring seamless integration across internal platform systems.
Reviewing submittals, translating specifications into clear system graphics, building reusable components, performing QA and compliance checks, and delivering final assets to engineering and field teams form a continuous workflow in which technical requirements are interpreted, visualized, validated, and handed off for implementation, ensuring that every graphic accurately reflects the project scope, supports system functionality, and is ready for installation and commissioning.
Key factors:
-
Strategically allocated design assets and migrated layouts to support optimal functionality.
-
Delivered live design implementations both on-site and remotely, collaborating directly within client systems.
-
QA. Align visuals with workflow needs.
-
Presented UI proposal to stakeholders and adapted in real time for smooth execution.
Click on the project categories below to view each one in full detail.
HVAC APPLICATION SYSTEM

HVAC Application System
Customer: Sheboygan, Wisconsin manufacturing plant. Designed application interface and custom libraries. Connectivity to a client network server to read live point data readings.

Airport Terminal 5 HVAC Panel
Customer: Chicago O'Hare Airport. Refer to the engineering submittal to identify the temperature sensors (stats) required for integration into the panel display. A client network server that retrieves real‑time point‑data readings.

HVAC Application System
Customer: Stryker. Designed application interface and custom libraries. Connectivity to a client network server to read live point data readings.

HVAC Application System
Customer: Stevenson High School. Designed application interface and custom libraries. Connectivity to a client network server to read live point data readings.

HVAC Application System
Customer: General Richard Jones Armory. Designed application interface and custom libraries. Connectivity to a client network server to read live point data readings.

HVAC Application System
Customer: Concordia University. Designed application interface and custom libraries. Connectivity to a client network server to read live point data readings.

Health Building Dashboard
Building energy and occupancy dashboard. Create custom gauges to reflect specific readings, measure temperature and air quality index. Detection sensor per floor/offices.
ENERGY DASHBOARDS


Control Point HVAC Interface
Customer: Amita Health. Kiosk tablet device to view floorplan, RTU's, EF's & VAV's units. Connectivity to the hospital network server.
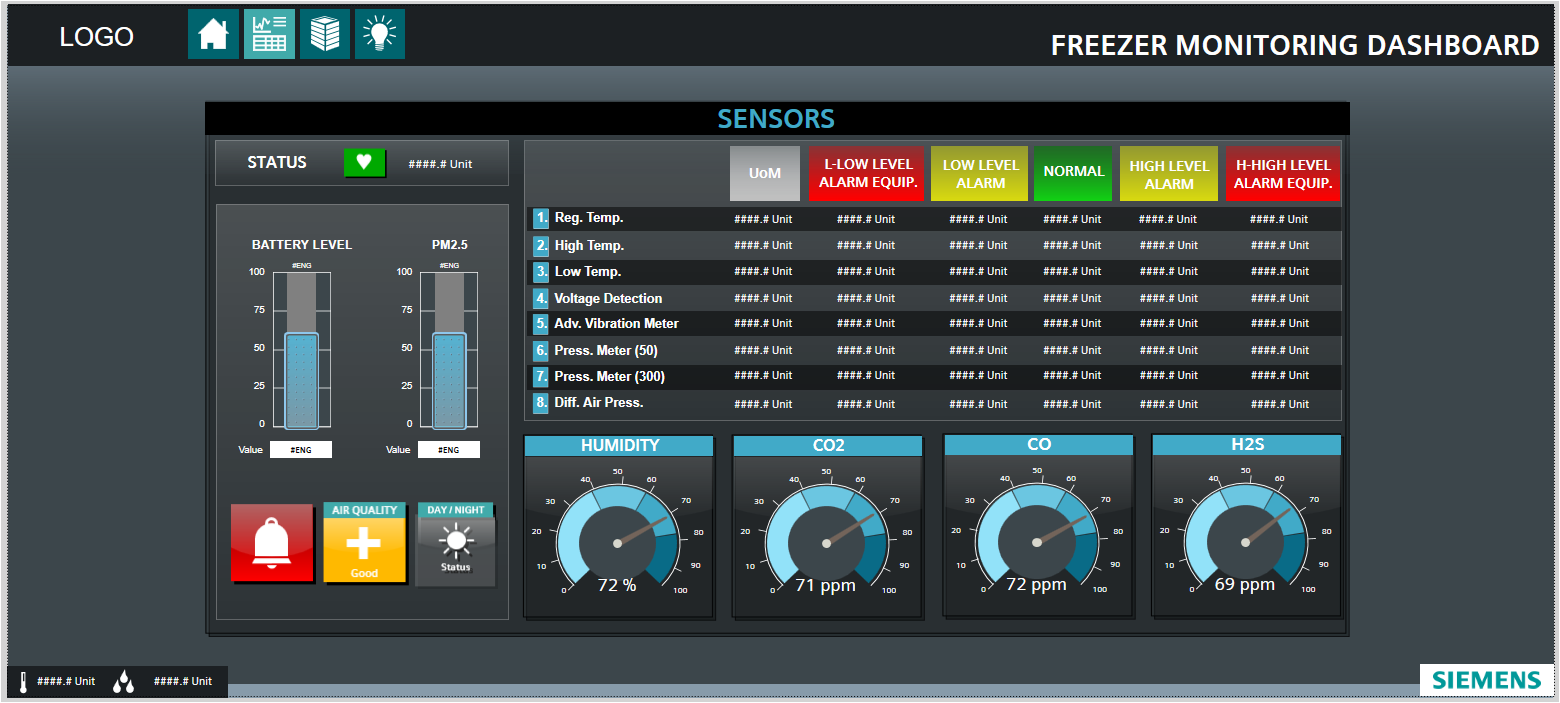
Wireless Critical
Monitoring Dashboard
Freezer Monitoring dashboard readings with data/alarm levels. Vaccine temperature greatly impacts its shelf life and potency.
AQI Dashboard
Building energy and occupancy dashboard. Create custom gauges to reflect specific readings for air quality index.

Health Building Dashboard
Building energy and occupancy dashboard. Create custom gauges to reflect specific readings, measure temperature and air quality index. Detection sensor per floor/offices.
CONTROL POINTS

Control Point Interface
Customer: Amita Healthcare. Tablet device to view patients room temperature readings. Connectivity to the hospital network server.

Control Point OR Interface
Customer: NorthShore Hospital. Kiosk tablet device to view OR / patients rooms temperature gauges, alert alarm and trend chart readings. Connectivity to the hospital network server.

HVAC Menu Interfaces
Customer: Northwestern Hospital. Designed and customized menu screen interfaces and icon libraries.